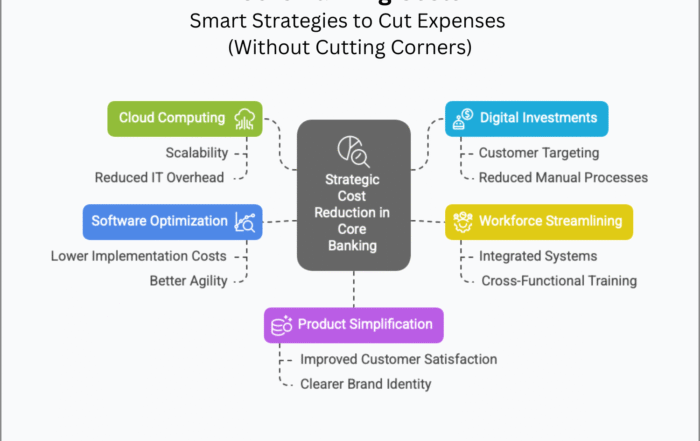
Too many KPIs can cloud your strategy. Focus on a few key metrics that truly drive business outcomes to align your core banking transformation with success.
Ever sat through a metrics review meeting and left more confused than informed?
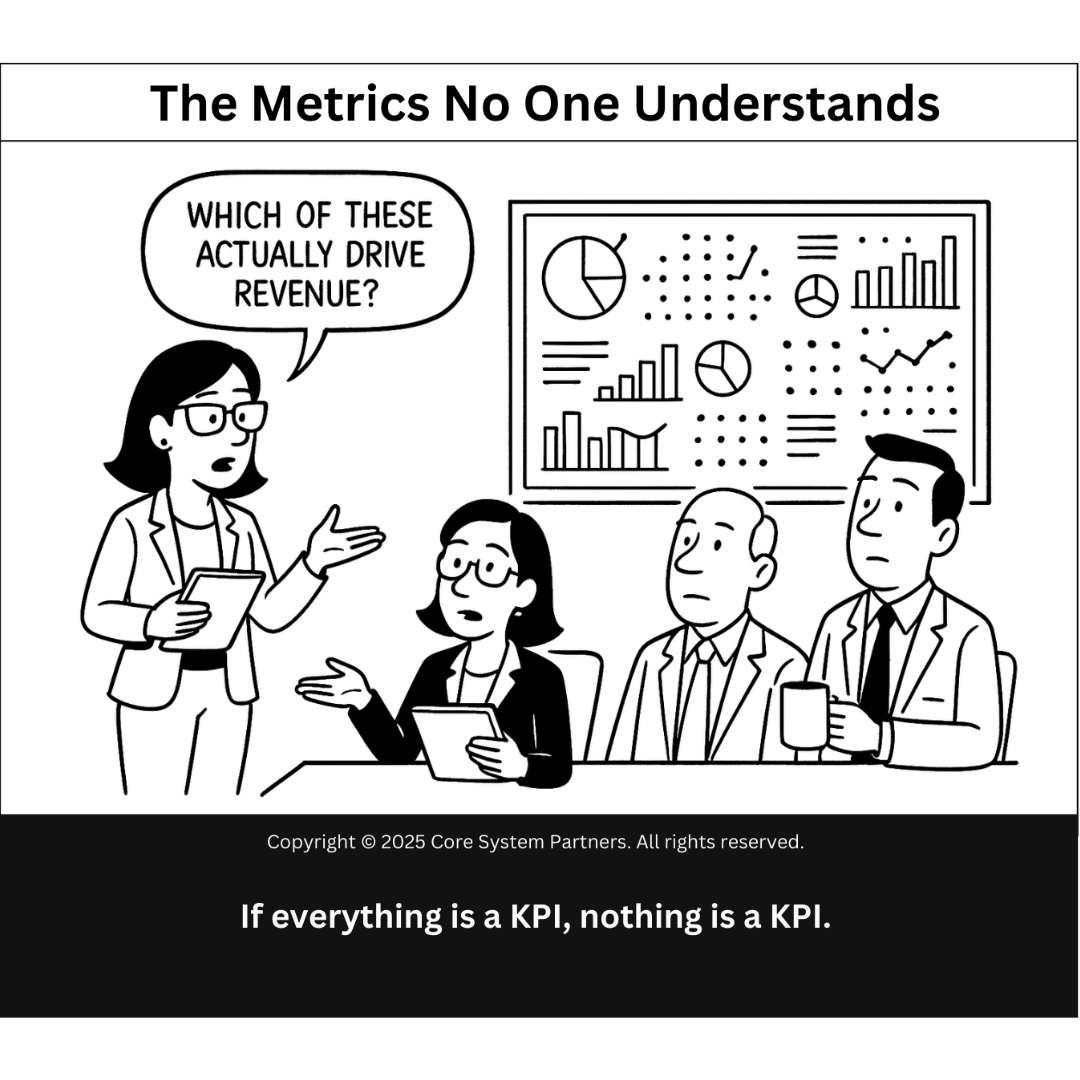
You’re not alone. I was once in a room with a bank’s senior team, staring at dashboards that looked like modern art—impressive, colorful, but totally indecipherable. The CMO finally asked the million-dollar question:
“Which of these actually drive revenue?”
Silence.
That moment is captured perfectly in the cartoon above. It’s funny—until you realize it happens all the time. Too many metrics. Not enough meaning.
If Everything Is a KPI, Nothing Is a KPI
We’ve all been there: buried in dashboards, reports, and scorecards that measure everything. NPS, churn rate, MAU, time-to-yes, STP percentage, net deposit delta… and that’s just Monday morning.
But here’s the truth: if your organization tracks 80 KPIs, you don’t actually have 80 priorities—you have none.
KPIs (key performance indicators) are meant to highlight what truly matters. When they become a catch-all, they lose their edge—and your team loses focus.
Why KPI Overload Happens (and Keeps Happening)
Let’s be honest. There’s a comfort in measuring everything. It feels thorough. It gives the illusion of control. But in practice, it can lead to:
- Decision fatigue – When everything is a signal, nothing stands out.
- Cross-functional confusion – Different teams optimize different metrics, pulling in opposite directions.
- Performance theater – Endless time spent tweaking dashboards instead of improving outcomes.
- Inaction – People get stuck in analysis mode because the real picture is too foggy.
And here’s a subtle danger: data overload can mask strategic drift. It’s easier to fiddle with metrics than to face hard questions about business direction.
How to Tell If Your KPIs Are Broken
If you’re unsure whether your KPIs are working for you or against you, here are some red flags to look for:
- Nobody can explain how the metric ties to business outcomes.
- Different teams use the same metric differently.
- Metrics conflict—one goes up, another goes down, and no one knows which to follow.
- The dashboard is more complex than the strategy.
- You’re measuring something because the system makes it easy—not because it’s useful.
Sound familiar?
What a Good KPI Actually Looks Like
Let’s reset the bar. A good KPI is:
- Actionable – It drives decisions.
- Aligned – It supports strategic objectives.
- Accountable – Someone owns it and is empowered to move it.
- Leading or lagging – It tells us something before or after outcomes occur—but we know which.
- Simple – If it takes 10 minutes to explain, it’s a report, not a KPI.
From Dashboard Clutter to Strategic Clarity
Here’s how to cut through the noise and bring your metrics back into focus:
1. Start with Strategy, Not Data
This is where many banks get it backward. We build dashboards based on what the system can report—not on what the business needs to know.
Flip that. Ask:
- What are our most important outcomes this year?
- What are the biggest risks to achieving them?
- What are the levers we can pull to influence those risks?
Only then should you select what to measure.
2. Limit the Number of KPIs
Pick 5–7 real KPIs at the executive level. Yes, that few. These should represent your North Star metrics.
Subteams can have their own supporting indicators, but they should ladder up to the main ones. More doesn’t mean better—it just means blurrier.
3. Assign KPI Ownership
Every KPI should have a clear owner who understands it, can act on it, and is accountable for its movement.
If no one owns it, or if three people “sort of” do, it’s not a KPI—it’s a scoreboard nobody’s playing to win.
4. Tie KPIs to Incentives
If you want people to care, make it matter. KPIs should influence bonuses, performance reviews, and team priorities.
Otherwise, they just become screensaver metrics—pretty to look at, but ultimately ignored.
5. Review and Adjust Regularly
Business priorities change. So should your KPIs. Build a quarterly rhythm where you revisit what you’re measuring and why.
Ask:
- Has this metric helped us make better decisions?
- Is it still aligned with where we’re going?
- Does it need to evolve—or be replaced?
The KPI Disconnect in Core Banking Transformation
Let’s bring this home to the core banking space.
In transformation projects, KPI chaos is everywhere. We track:
- Number of JIRA tickets closed
- Number of environments deployed
- Regression test cycle duration
- Number of UAT defects
- Training sessions completed
All of these have value—but none of them, alone, answer the most important question:
Are we delivering measurable business value from this transformation?
That’s the KPI that should sit at the center.
A Real-World Example
One mid-sized bank we worked with was drowning in project KPIs—literally dozens across multiple workstreams. The PMO had beautiful charts but couldn’t tell the CEO when they’d see a return on the investment.
We helped them distill their metrics down to a handful of enterprise-level indicators tied to strategic goals—customer onboarding time, core transaction cost, cross-sell ratio, and NPS movement.
Suddenly, the leadership team had a dashboard they could actually use. Project teams still tracked their detailed metrics, but everyone was rowing in the same direction.
Final Thoughts: Less Is More
Let’s not confuse activity with alignment. You don’t need more data—you need better focus.
As the cartoon reminds us:
If everything is a KPI, nothing is a KPI.
So let’s make your KPIs count. Because the real key performance indicator… is progress.
What Next?
Wondering if your KPIs are setting your transformation up for success—or sending you in circles?
Take the OptimizeCore® Scorecard. It evaluates whether your metrics align with your strategy, your culture, and your execution model.
Let’s stop admiring dashboards and start making decisions.
#CoreBankingTransformation #CoreBankingOptimization